
For more than 20 years, the major question that news organizations, funders, and support organizations have been struggling to answer is: How can newsrooms achieve sustainability?
That’s why it’s been so valuable for the field that LION Publishers developed a clear and useful definition of just what sustainability is and what it entails, as well as a maturity model that tracks where an organization is on its journey. LION defines sustainability as the ongoing alignment and mutual reinforcement of sound operations, financial health, and journalistic impact. An organization is at one of four stages as it progresses toward the ultimate goal of sustainability: Preparation, Building, Maintaining, or Growing.
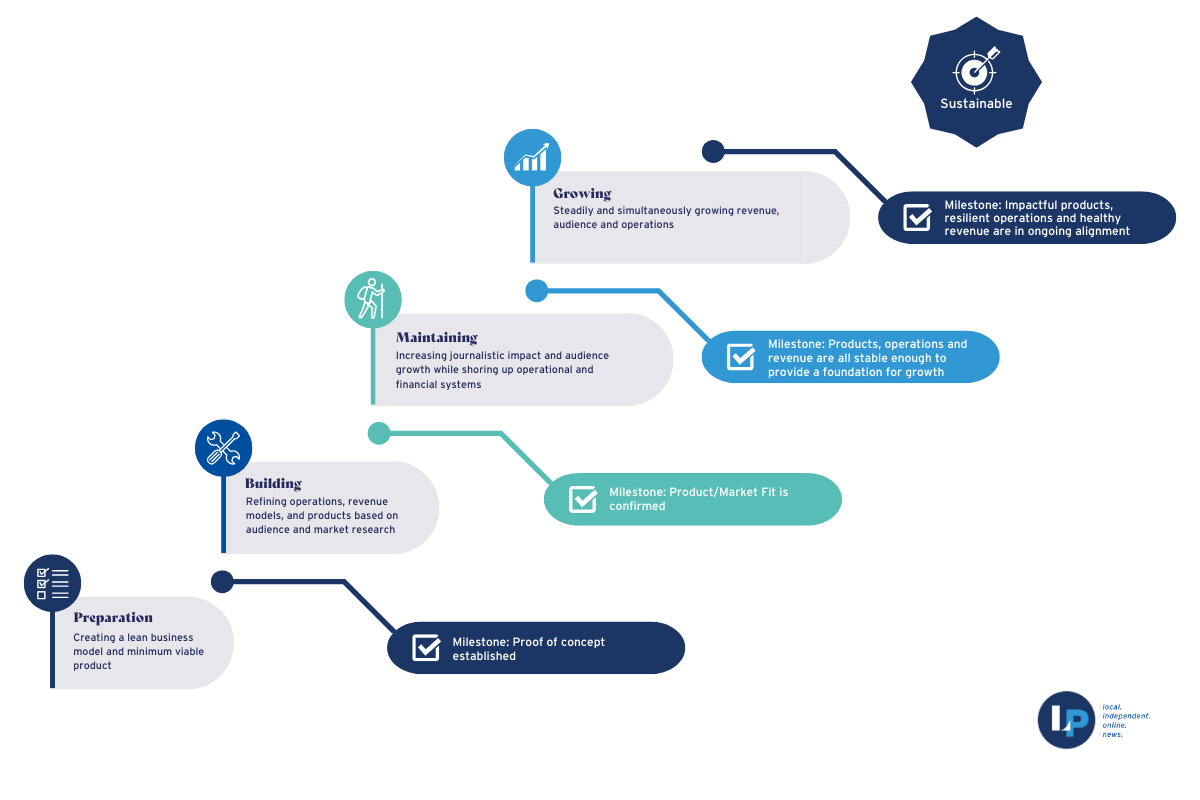
LION’s Maturity Model
LION’s Sustainability Audits are the testing ground for this theory of sustainability. The Audit questionnaire is broken up into the three pillars of sustainability, and the results of the audit assign organizations into one of the four stages. Since its launch in 2021, over 400 organizations have participated in an audit, which has generated a huge amount of data.
In 2024, Impact Architects partnered with LION to work through the data. The purpose was to identify the most useful data points from the Sustainability Audit to be able to determine where a newsroom sits in the four stages of maturity and to refine the sustainability pillars. The work contributed to and helped make possible the development of LION’s streamlined Sustainability Audits, which provides open access for all LION members to participate and receive automated action items to help newsrooms maintain their momentum and growth.
How we did it
Reduce
In order to identify what indicators were most closely tied to sustainability, we had to make the data more manageable. The dataset we started with included well over 100,000 datapoints from the more than 300 audits taken from 2021 to the middle of 2024. We first culled the fields to those that are most relevant, focusing on what organizations do rather than what they have. For instance, we decided that whether or not an organization uses a specific piece of software (such as which CMS or CRM they use) is unlikely to correlate to their path toward sustainability, but rather, a better indicator would be whether they have these things at all.
Reduce (again and again)
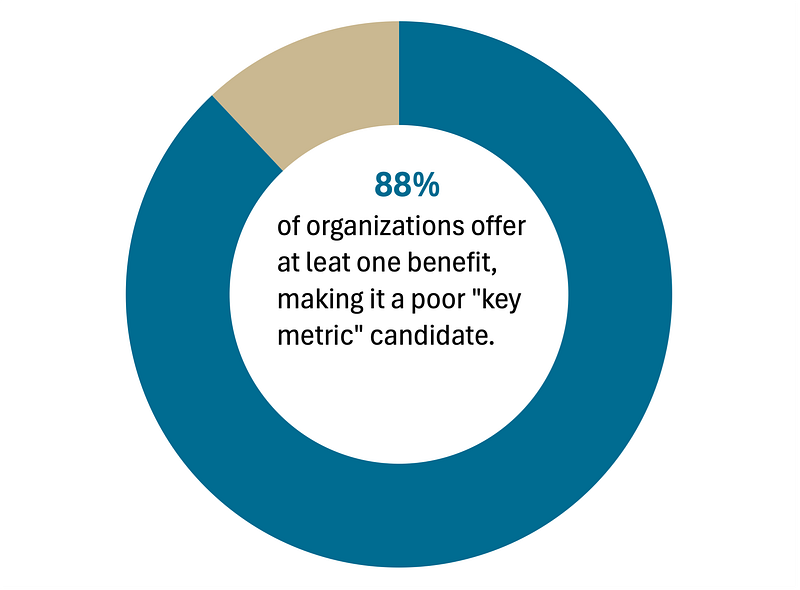
The next steps focused more on how organizations answered the questions than the questions themselves. We sought out questions that had either affirmative or negative responses from most organizations, regardless of stage. For example, one question asked about benefits. Respondents selected from a variety of potential benefits offered, from medical insurance, to dental insurance, to paid time off. We found that nearly 90% of participants offered at least one benefit. For that reason, we determined that these and similarly disproportionate measures were not going to be useful for defining a sustainability pillar or distinguishing among stages.
We went through this process a few more times, changing the parameters a little bit each time to home in on the most indicative data. One way we did this was to remove questions for which more than 75% or less than 25% of organizations responded in the affirmative, which helped us focus on practices with more informative distribution across stages. The final round removed questions that, while reflective of a healthy organization, were too subjective to the individual participating, such as “We have built a culture of giving and receiving feedback.”
Clustering and correlating
After many rounds of cutting, we arrived at 34 of the most meaningful indicators for the sustainability pillars: 17 for the operations, nine for the financial health, and eight for the journalistic impact pillar. To sharpen the focus, we conducted a cluster analysis to model different versions of stage assignments based on the organizations’ total scores, and then we tested the distribution of given metrics. This helped us identify the most indicative metrics on a more granular level. The chart below shows the total score among organizations, color coded by a single measure.
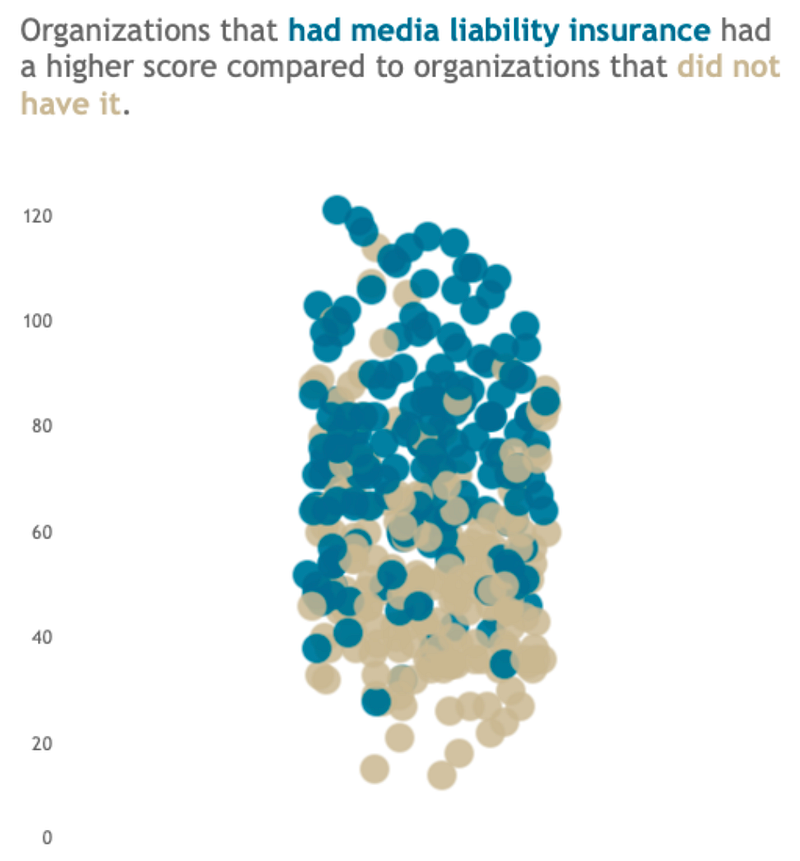
We then conducted a more detailed analysis of distribution across five and four stage models to identify indicators that show a steady progression across stages, as the chart above suggests. We settled on 21 indicators for the final version.
What’s next
As more and more LION members participate in the audit, the dataset grows. We’re happy to be partnering with LION again in 2025. Making sense of the data with LION enables us to make it more useful to the field at large, as we collectively hope to show the relationship between sets of practices publications implement and tangible signs of progress toward sustainability. As more organizations participate in the Sustainability Audit, and as more do so for the second and third time, we will be sure to have questions about how our previous conclusions hold up, as well as what additional lessons there might be for local news organizations.
If you need support making sense of your data, reach out.