
In this post, Rosemary D'Amour and I share our recommendations on building clear, compelling data sets.
Tracking impact in a systematic way can be daunting. The (understandable) urge is to include lots of description, detail, and nuance. However, in order to generate qualitative datasets that can be analyzed in aggregate, qualitative data need to be gathered simply and clearly.
But how to structure qualitative data? IA’s Impact Tracker is an approach to create qualitative datasets using a webform to document instances of impact. Each question or field in the webform is one piece of structured data. But structure does not mean there can’t be depth: there’s a longer form description field where the person recording an impact can provide lots of detail, too.
As organizations embark on creating qualitative impact datasets, either through surveys or ongoing impact tracking, we’ve fielded common questions about how to structure web forms and databases, and we’ve noticed some common challenges. Based on these observations, we’re sharing some best practices to keep in mind when creating a webform:
Ask clear questions
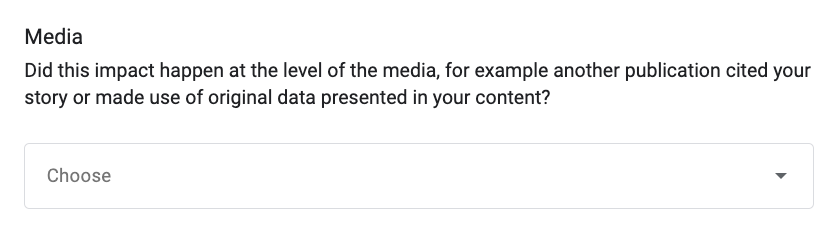
Be sure that each question asks only one thing to ensure that your data are reliable and clean. Think: one question, one answer, one cell on a spreadsheet. And provide plenty of context in the form with any needed definitions or explanations for each question. This can be as simple as “Date the impact occurred” rather than “Date” to ensure someone understands they’re documenting data about the impact, not about the day they got around to creating an entry, to something more complex like providing a full definition of what is meant by “Individual Impact.”
“Media” impact field with descriptive prompt from a news organization’s impact entry form.
2. Single vs. multiple selection within a question
Whenever possible, have questions be single selection, meaning you can click on only one supplied answer per question. This does two things: first, it forces the person documenting impact to decide what it is a best example of; and second, the data can be much more meaningfully visualized and analyzed. When an impact entry is labeled as 2, 3, 4 or more types of impact at once, it starts to lose meaningfulness and the data become very messy.
3. Always let people be unsure!
Keep an “other” or “unsure” category for any multiple choice questions, and/or don’t make questions be required to submit an impact entry. In some cases, the impact is so unique that it doesn’t quite fit. In others, the person creating the entry might not be sure, and the person maintaining the database can assign data categories.
Custom field on impact entry form for a news organization that includes an “other” option.
4. Keep forms as short as possible, but with all necessary information
We often hear, “but entering impact takes time!” While this is true, if you keep the entry forms short and sweet, it should take less than a minute to create an entry. The key is to determine what information is critical, and what is actually extraneous when it comes time to analyze the data. And, as with #3 above, making only the most critical responses mandatory and leaving the rest as optional increases the likelihood that someone will submit an entry and not get flummoxed by any one question and give up.
Sometimes, it makes sense to keep the form that will be used by many people very short, and leave fields to be assigned systematically by someone on the back end. This has the dual benefit of making it easy for people to complete the form and increasing the likelihood of clean data. And, as with
5. Open-ended questions
While we want elegant, clean, structured qualitative data sets, we also don’t want to lose the richness of impact stories. We often recommend two open-ended fields. The first is a topline, “In 2 sentences or less, what happened?” This should be the key information that you’d want someone to have if scanning a column in a spreadsheet.
The second open-ended field can be longer form and invite the person creating the entry to add as much detail as they’d like. While this won’t be the most useful for larger data analysis, these rich narratives can be useful for illustrating trends, providing additional detail and information, and communicating the impact with diverse audiences.
And if you are using or plan to use a Google-based Impact Tracker, here are two platform-specific challenges we’ve observed:
Use an admin email account to create the Google Form, responses sheet, and Looker Studio Impact Dashboard
Any person with a Google account in an organization can create the webform and Looker Studio dashboard and then transfer them to another account within the same organizational domain. However, sometimes people leave organizations unexpectedly, or not unexpectedly but without transferring ownership of the platform all the same. In the case that a defunct account is deleted (rather than archived), the data will disappear. We recommend using an admin email account that will remain with the organization as long as Google keeps Googling.
2. Consider requirements for uploading files
Uploading files via a Google form requires a respondent to be logged into a Google account. This can be a speed bump in someone’s attempt to create an impact entry, potentially turning them off from participating in the future. Organizations should weigh the pros and cons of having file uploads enabled, and if the decision is to keep this capability turned on, clearly communicate to those who will be completing the form that they will need to be signed in so they are not surprised.
As you begin to structure a form, either for a survey or through a qualitative form like the Impact Tracker, we encourage users to think about the end result–what questions do you want to have answered? What questions will stakeholders, like funders or editors, have about the impact of your work? When you follow these best practices, you’ll find that visualizing the qualitative data you’ve gathered becomes simpler, meaning you’ll be able to generate insights, analyze trends, and tell your impact story more effectively.